Further evidence and feasibility for the extended Robert Edgar Hope-Simpson (REHS) hypothesis for the transmission of respiratory viruses such as Covid-19 and Influenza
Robert Edgar Hope-Simpson was right on all counts
Highlights of this article;
· Why respiratory viruses such as influenza and covid-19 are strongly seasonal
· Why certain South American countries were so severely impacted during the pandemic
Introduction
This article examines the feasibility of the extended REHS hypothesis for the mechanism of transmission of respiratory viruses such as covid-19 and influenza. This hypothesis has been explained in depth in previous articles (1). This hypothesis requires that highly specific conditions of low level Ultra Violet (UV) light are involved in the triggering and selection of successful mutations of respiratory viruses such as covid-19. We know that both influenza and covid-19 are highly seasonal and this article will demonstrate why this is the case.
Examination of seasonal emergence of UV light conditions
To demonstrate the feasibility of this hypothesis we need to know the specific UV light conditions required to trigger the covid-19 virus. The only study (2) that I am aware of that provided direct evidence for this phenomenon gave some details of wavelength, intensity and time of exposure but translating this into real world UV exposure is virtually impossible. In addition, where measurements exist, they simply assess a crude UV intensity and exposure related to potential skin damage. However, we can examine this relatively limited UV daily data assuming that intensity and duration at the relevant period must contain the component of specific UV light conditions capable of triggering the virus. To make this assessment we need to know when the UV light conditions are likely to have emerged and then examine those conditions with other times of the year when the impact of the virus is greatly reduced. In a previous article (3) I concluded that using excess mortality data we could indicate when this UV triggering was most likely to occur.
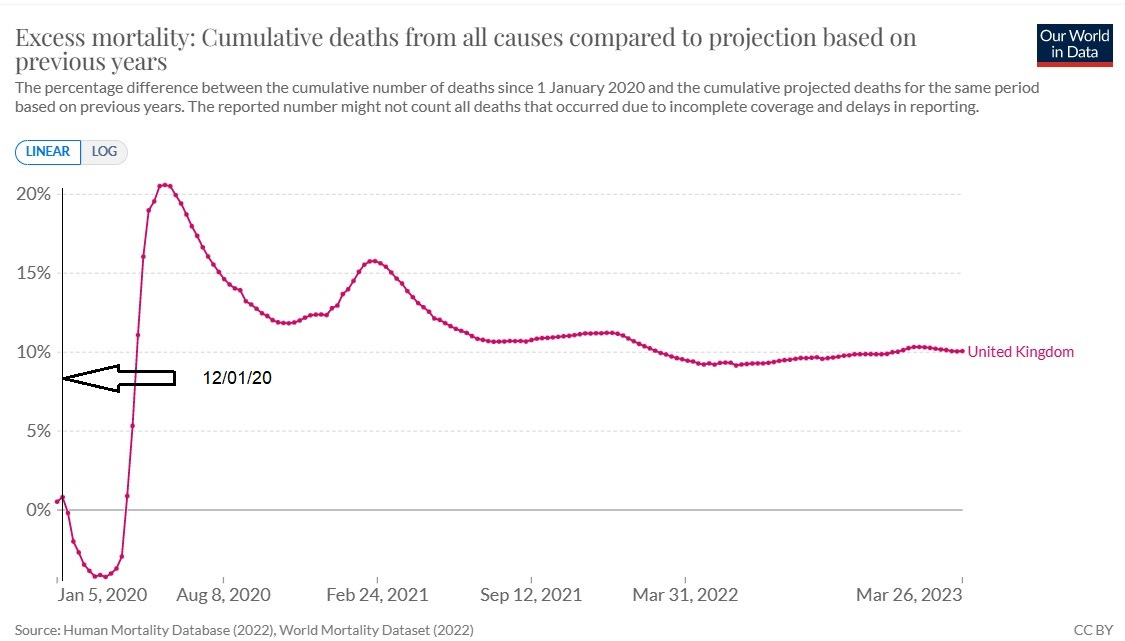
This is the graph from that article that forms the basis for estimating the trigger date for the UK;
We can see that the conditions must occur prior to the beginning of the mortality dip (12/01/20) and allowing for infection to death estimates this would translate to a mid-December date. We know that this triggering occurs within a three to four day window (4) across all ten regions of the UK and Scotland so let us examine the UV conditions that existed at that time. This data is available from the Department for Environment Food & Rural Affairs (DEFRA) (5).
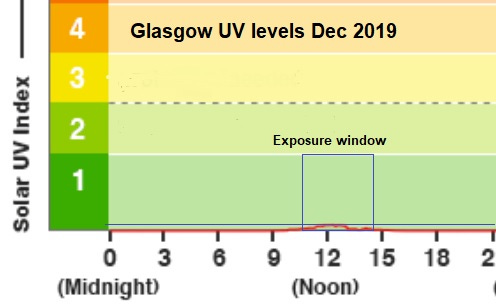
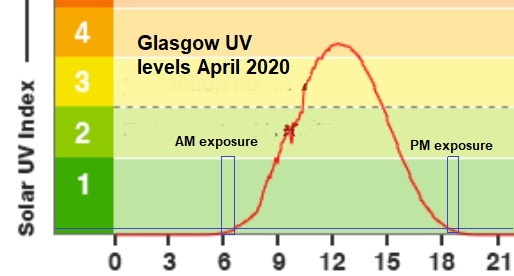
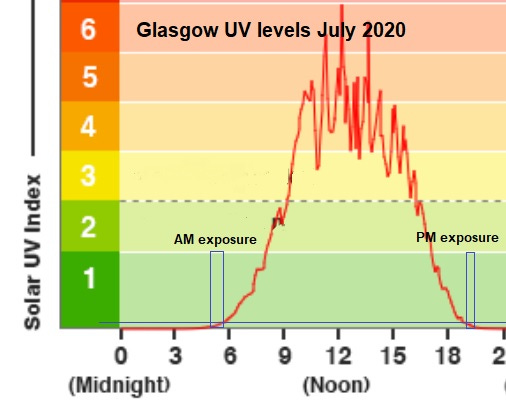
I have taken three sets of data from two UK UV monitoring stations; Glasgow (North) and Camborne (South West). The data is from specific days and is deemed representative of this time window.
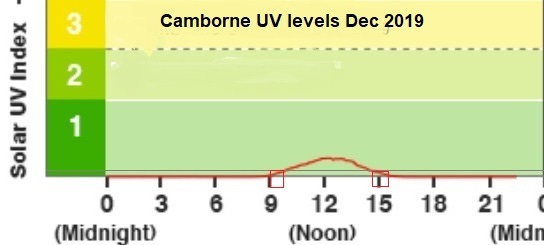
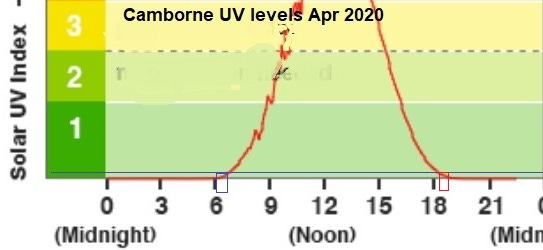
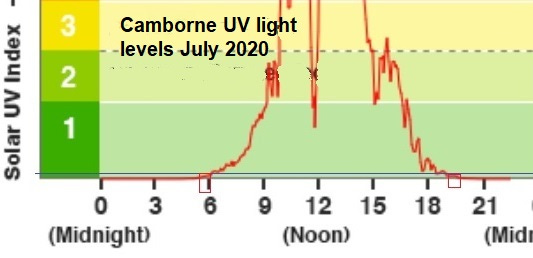
I have assumed that the light levels that exist in mid-December are required for activation (below the thin horizontal blue line) and then superimposed those levels to the months of April and July for comparison. I have then added windows (blue rectangular boxes) estimating the equivalent low level UV conditions that exist during those three selected representative days. What is immediately evident is that the periods of relevant UV conditions that are required are appearing on a much shorter basis and much earlier in the day in April and July when compared to December. Consequently, the number of individuals that are likely to be exposed and activated to these conditions is therefore much less likely during the months of April and July as opposed to December. There are a lot of estimations that I have made but the principle of strong activation during December in the UK is strongly supported by this data.
Let us now examine a region 400 miles further South; Camborne -
The UV levels for Camborne are significantly different to that of Glasgow in that they are not extended through the day to anything like the same extent, but the relevant time of day and duration is still much greater in December. Consequently, we would expect a significant mortality difference between these two regions. The regional mortality peak data for Camborne (Cornwall) was 52% on the 17th April whereas Glasgow (Inverclyde and East Renfrewshire) had a peak one week later at 143%. Whilst population density must have an impact with respect to transmission, there are still large differences between these two regions which would have been predicted by the level of UV exposure and activation.
The pandemic impact on South America
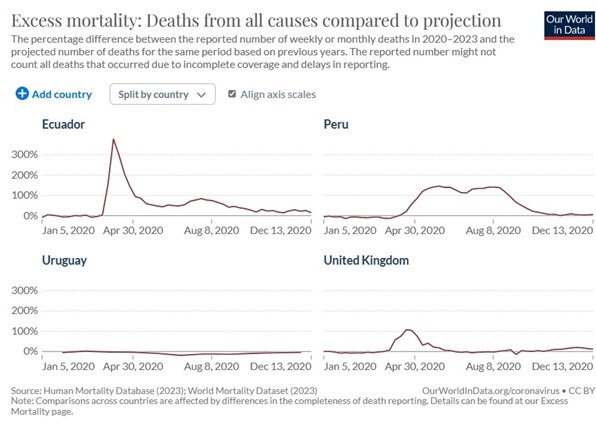
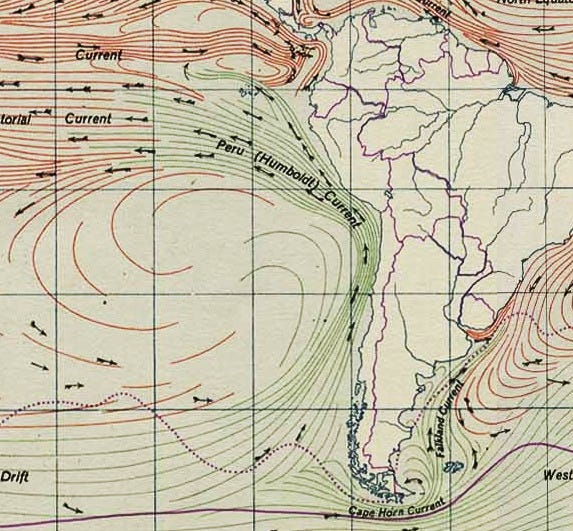
The impact of low-level UV light conditions was even more dramatically demonstrated in countries where these UV light conditions persisted both daily and seasonally. This was dramatically demonstrated by the excess mortality peaks seen in Ecuador and Peru during the pandemic. A feasible explanation for this extreme response is the proximity to the equator and the Humbolt current creating a persistent daily haze/ mist that is known as Garúa (6) creating the specific conditions required for extensive activation and greater mortality impact. This haze / mist absorbs UV light thus potentially providing the specific conditions required for activation of the virus. Here are graphs demonstrating the excess mortality impact of the pandemic;
I have added Uruguay as a South American east coast country that was not impacted by the Humbolt current and the UK to provide further perspective.
To illustrate this point further we can see the correlation of the proximity of the Humbolt current and mortality peaks;
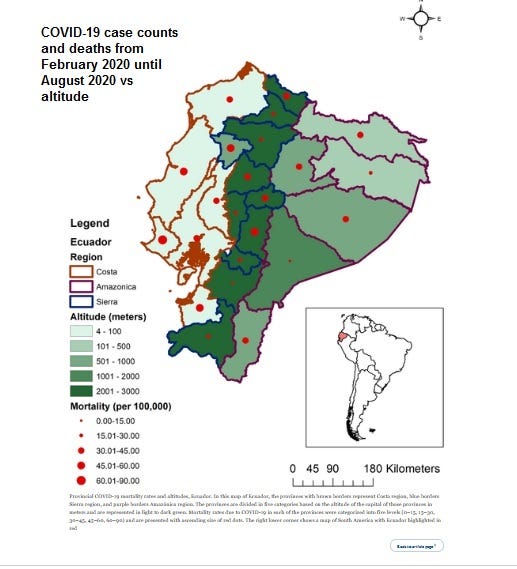
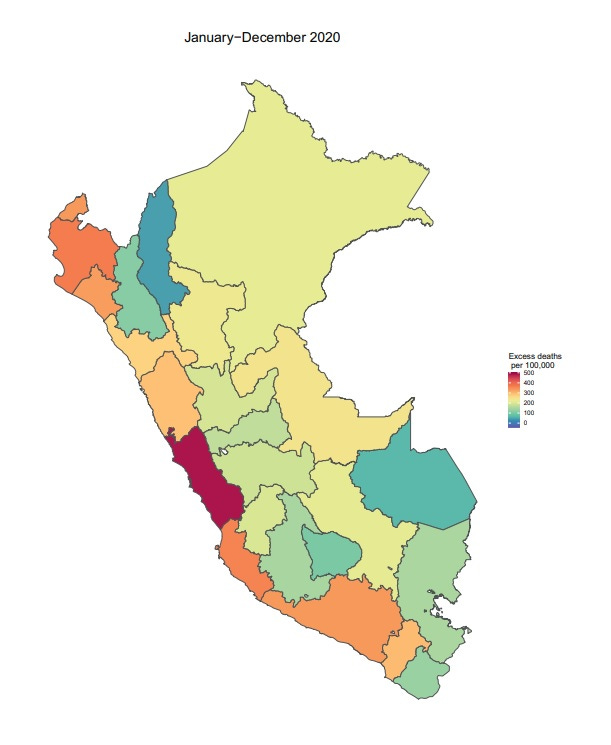
The mist / fog conditions are quite unique and form a persistent haze impacting on the level and wavelength of UV light reaching the earth’s surface. Garúa is a Spanish word meaning drizzle or mist. Although used in other contexts in the Spanish-speaking world, Garúa most importantly refers to the moist cold fog that blankets the coasts of Peru, southern Ecuador, and northern Chile, especially during the southern hemisphere winter. These unique conditions sadly resulted in a dramatic mortality impact and because the haze / mist conditions persist for significant periods of the year this is reflected in the excess mortality graphs for Ecuador and Peru shown above. The mists and fog tend to only impact localized coastal areas so if we examine the specific mortality impact for Ecuador and Peru we can see if this agrees with this concept.
Ecuador mortality impact
Peru morality impact
Conclusions
The information provided in this article provides further evidence for the extended REHS hypothesis and offers a reason why seasonality is so influential in the activation of respiratory viruses such as covid-19. In addition, it offers a plausible explanation of the dramatic impact of covid-19 on Ecuador and Peru.
References
(1) https://open.substack.com/pub/sandrews/p/were-charles-darwin-and-robert-edgar-232?r=16e1vo&utm_campaign=post&utm_medium=web
(3) https://www.sciencedirect.com/science/article/pii/S2666469021000920?via%3Dihub
(5) Department for Environment, Food & Rural Affairs - GOV.UK (www.gov.uk)

