Highlights of this article based on empirical data not modelling.
· A plausible explanation of the ongoing excess deaths seen since June 2021.
· Evidence that the Omicron variant was also a product of gain of function.
· Why lockdowns are a completely ineffective against respiratory viruses.
· Why the vaccinated were possibly more susceptible to symptomatic Omicron infection.
I recently wrote an article demonstrating the feasibility of an alternative covid-19 transmission hypothesis that is an extension of the work performed over 30 years ago by Robert Edgar Hope-Simpson (REHS) (1). There was some good feedback on this article but one reader pointed that the emergence of the Omicron variant was ducking the seasonal trend that is fundamental to this alternative transmission narrative.
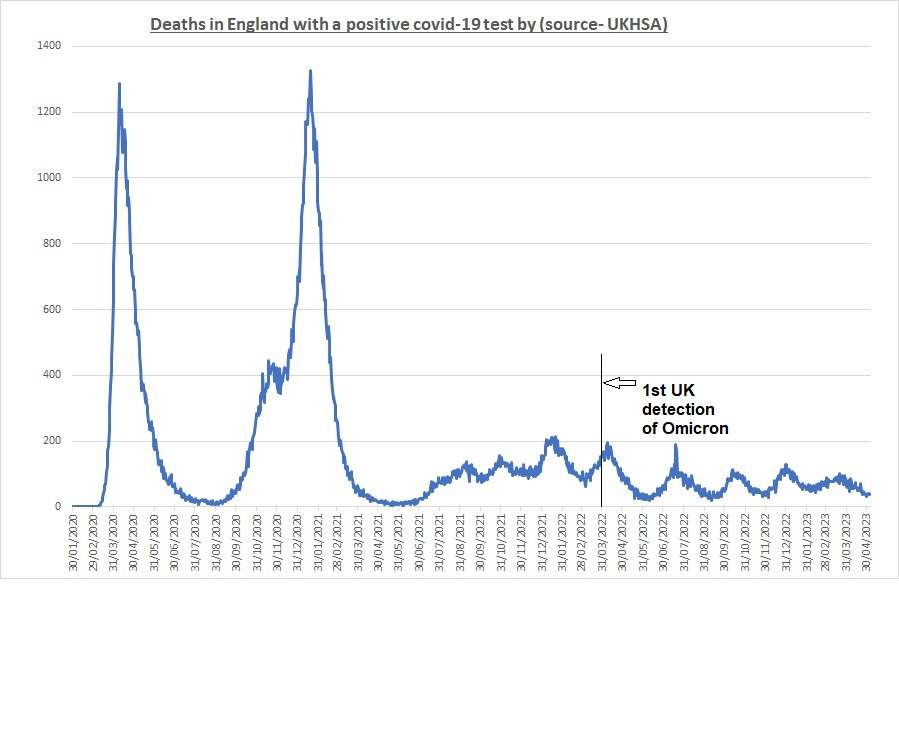
Omicron appears to have a greater rate of mutation than previous covid-19 variants. This mutation is not seasonal. This can be demonstrated if we examine data from the United Kingdom Health Security Agency (UKHSA). The downloaded data is presented in the graph below (Fig 1).
Fig 1:
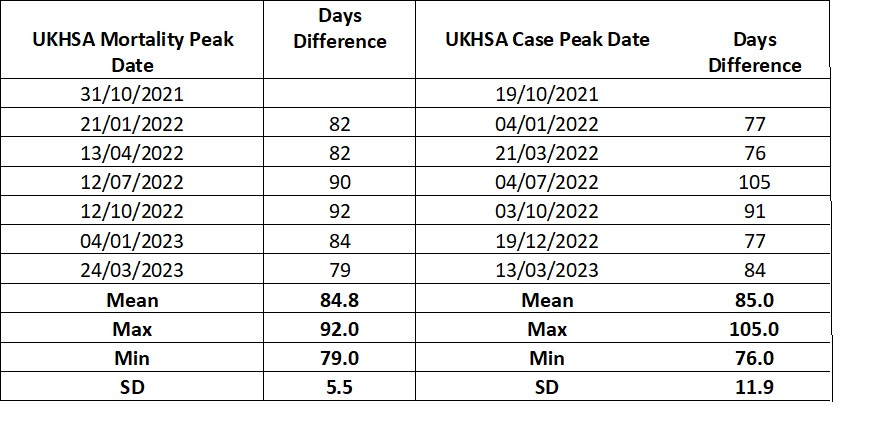
We can see that there are large positive peaks that, according to the extended REHS hypothesis, are seasonally activated. However, when we move to the point at which Omicron was first “officially” detected (England – 31/01/22) we can see there is evidence that the peaks are not seasonal. The distinct peaks are nothing like as intense as the Wuhan, Delta and Alpha waves. Here is a table providing the peak date and days between mortality peaks in the UK:
Table 1:
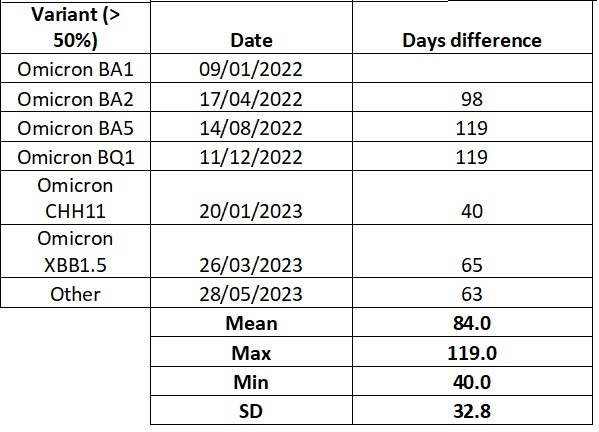
We can also examine this cycling using the emergence of the of the Omicron variants.
Table 2:
The cycle times are in good agreement, but this is not entirely surprising as it is all based on a common test procedure. Based on this data we can conclude that Omicron is not seasonally activated as the peaks are appearing in the summer months in England at intervals of around 85 days.
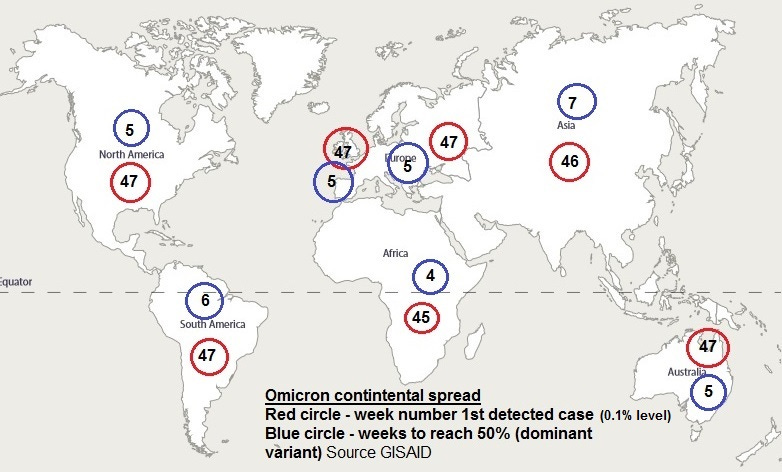
Let us now examine the Worldwide emergence of Omicron. The first data is from the GISAID web site that is a repository for Worldwide variant emergence (Fig 2).
Figure 2:
We can see that Omicron apparently spread around all continents of the world at approximately the same rate in under two weeks. This demonstrates that the conventional person to person transmission model is entirely flawed. The first detection was in Southern Africa.
A more detailed analysis of Omicron emergence is presented below using the World in Data site (Fig 3). This data is based on case peaks for individual countries where data is available.
Figure3:
This paints a slightly more variable picture and is slightly at odds with the GISAID data. For instance, the area around China appears to be peaking much later than the rest of the world. This data must incorporate variation in case detection and reporting from the individual countries but there is a definite anomaly for this region that remains unexplained. The centre remains around Southern Africa but the conventional transmission model once again breaks down when we see that regions in Africa thousands of miles apart are peaking within a week of one another.
What does this data tell us? It indicates that the virus has embedded within a population and then is reactivated. This activation mechanism, for the Wuhan and variants up to Omicron were driven by mutation and seasonal ultraviolet light conditions. This made them much more explosive and even more synchronous in regions that were exposed to the same UV light stimulus, and this has been presented in depth in previous articles (2)(3). The only explanation that I can provide for this explosive emergence of Omicron is that there was, as a minimum, a dual release of gain of function variants. Both viruses initially embedded at a low level that did not activate the immune systems. This low embedding offers a survival advantage for a virus and has been outlined previously in greater depth (2). One escaped variant dominated over the other and suppressed Omicron as was the case with influenza and RSV. When the prevailing immune response was so great for the initial Wuhan variant waves Omicron rapidly emerged on a global basis. The prevailing state of the immune system has been possibly primed by the initial waves so the case data and mortality response will be impacted. Since the suppression of viruses by other pathogens, known as pathogen interference (4), is a recognised phenomenon and gain of function origin is also widely accepted I do not know why has this proposal has not been previously suggested? It is also conceivable that in the low-level suppressed state the Omicron variant could mutate.
This proposal is also independently supported by the phylogenetic analysis of Omicron in that the extensive mutation can be traced back to a much earlier origin shown below (Fig 4).
Figure 4:
The lack of seasonality may be related to the way the Omicron variant cleaves as there is evidence that recombination of viral fragments may facilitate mutation and selection (5).
The favoured explanation offered by virologists and epidemiologists, in a desperate attempt to stick to the narrative, is that Omicron first emerged in an immune compromised individual(s) who harboured the virus which allowed it to continually mutate and then escape once it reached a certain virulence. This is at odds with nearly all the real-world data presented here. There are other proposals (6).
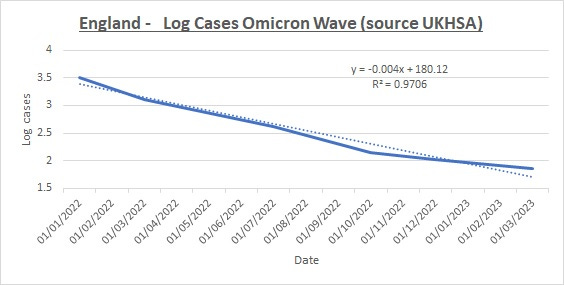
Let us now examine evidence that Omicron was evolving rapidly to evade the prevailing state of the human immune system and as previously indicated this involves an increase in mortality as the healthy are generating mutations that are potentially lethal to the unhealthy. To do this I have performed an analysis that I have not seen anywhere else. This analysis involves taking the date and intensity of the case peaks and correlating them with the mortality peaks and examining the difference and using this to estimate the peak case fatality rate (CFR) for each Omicron wave. Prior to presenting this data I would like to demonstrate the rapid response of the prevailing state of the human immune system to the emergence of Omicron. To do this I will perform a logarithmic plot (Fig 5) of the decline in cases for the England:
Figure 5:
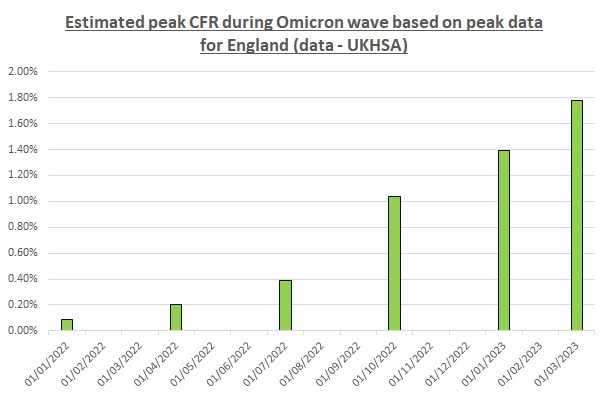
We can see that like all Covid-19 variant waves there is an exponential decline in cases. This was very concisely presented early in the pandemic in two YouTube presentations by John Daniels (7) and by Professor Michael Levitt (8). If we compare this with the decline in mortality, as seen in figure 1, we can see that it is much more linear. This indicates that there is a rapid increase in the CFR as we move through the Omicron waves but counteracting that is the rapid response of the prevailing state of the immune system. Here is the estimation of the CFR through each Omicron wave calculated based on mortality and case peak data (Graph 2):
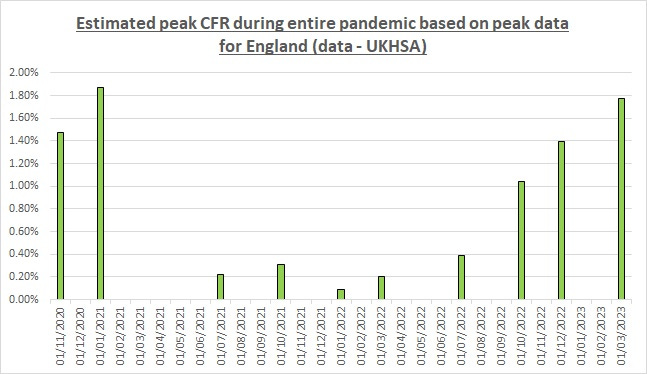
Here is the plot for the entire pandemic period (Graph 3):
We can see a sharp increase in CFR. The absolute numbers may not be accurate but the relatively of the peaks, provided the testing levels remained the same for mortality and case numbers, should be valid. This increase in CFR agrees with the extended REHS hypothesis and counters the accepted narrative that Omicron mutated to being less deadly. This was true in absolute numbers but not in terms of CFR as demonstrated by the chart above.
Where does overall increase in excess mortality come into the picture? If a virus is continually mutating at around an 85 day cycle then we will get a relatively continuous challenge from the healthy to the unhealthy giving rise to a steady excess mortality as indicated in the graph below.
The increased mortality that has been seen, virtually on a worldwide basis, may be explained by a rapid challenge by the healthy generating mutations and transmitting them to unhealthy individuals. Because their immune systems are less healthy this results in a rapid challenge and much more severe activation of their immune systems. This immune response results in other dormant pathogens and other infections getting a foothold resulting in increased mortality. It is important to realise that this will result in a multi factorial cause of death. To summarise an unhealthy terrain overwhelms the individual. It is conceivable that vaccination that redirects the immune system to a response for prior variants (antigenic sin) (9) may have a detrimental impact on mortality.
We can see the severe immune response by the prevalence of antibodies in the graph below.
Graph 4:
There is a rapid increase in (nonspecific?) antibodies to greater than 90%. I am interpreting as a massive redirect of the immune system. This redirect leaves a proportion of individuals more vulnerable to other diseases and pathogens this can then have secondary lethal effects from other health conditions. Consequently, there is a rise in excess death.
The dates I have added to this graph align with the dates of the first emergence of Omicron, for the observant amongst you will see that I have used the first mortality and case peak dates at 31/10/21 and 19/10/21 respectively. This start date does not align with the official narrative but is based on the first regular 85 day cycling. This correlates well with the sudden rise in antibodies seen above. To reiterate, the emergence of Omicron results in a massive immune response as indicated by the antibody level rise illustrated above.
Other supporting evidence
A long article (10) published by the Ethical Sceptic (Nov 2021) provides additional significant evidence in support of the above conclusions. However, his hypothesis on the mode of transmission deviate significantly from my previous posts. In this article he cites various papers supporting the early origins of Omicron one of which is referenced below (11).
Conclusions
The data presented in this article does not remotely align with the accepted transmission narrative or the proposals for the emergence of the Omicron variant. Alternative proposals for both aspects are proposed that are in closer agreement with real world data.
This data also indicates the dangers of gain of function research which is still conducted around the world under the premise of understanding and combatting the threat of a viral pandemic. I think it is safe to say that this is a very dangerous form of research as it enables the creation of viruses that are mutationally advanced for which our immune systems are relatively naive and therefore potentially lethal.
Reference / Links / Definitions
(5) The SARS-CoV-2 spike S375F mutation characterizes the Omicron BA.1 variant (cell.com)
(6) The origin of omicron is a mystery. Here's why we need to crack the case : Goats and Soda : NPR
(7)
(8)
(9) Original antigenic sin - Wikipedia
(10) China’s CCP Concealed SARS-CoV-2 Presence in China as Far Back as March 2018 | The Ethical Skeptic
(11) Kandeel, Beltagi, et al.; Omicron variant genome evolution and phylogenetics, 14 Dec 2021; https://onlinelibrary.wiley.com/doi/epdf/10.1002/jmv.27515
UKHSA definitions
Daily deaths with COVID-19 on the death certificate by date of death
Daily numbers of deaths of people whose death certificate mentioned COVID-19 as one of the causes, and 7-day rolling average. Because of the time it takes for deaths to be registered, there is a lag in reporting of at least 11 days, and data are not shown for the 14 days before the most recent reported date as they are considered incomplete. Data are shown by date of death.
Cases
Number of cases, by specimen date. Data for the last 5 days, highlighted in grey, are incomplete.
Variant percentage of available sequenced episodes, by week
The percentage of important UKHSA-designated variants from sequenced episodes by week from 1 February 2021. Variant episodes are assigned to weeks based on specimen date. Variants are displayed using UKHSA name (e.g. VOC-22APR-04) with World Health Organization (WHO) name (e.g. Omicron) and sub-lineage (e.g. BA.5).





I have read the Substack article provided in the link below. A good appraisal of the G of F situation. Regarding pathogen interference I thought one of the most powerful pieces of supporting evidence was the shape of the mortality curves which also indicatives of an earlier release. I tried to outline this in another article;
https://open.substack.com/pub/sandrews/p/how-on-earth-did-the-world-miss-the?r=16e1vo&utm_campaign=post&utm_medium=web
I have been more focused on the transmission narrative in particular the work of Edgar Hope-Simspson and have attempted add to his extensive work given the enormous amount of data generated during recent times.
How about overlaying the jab and boosters, Omicron was NOT as fatal. Its obvious once you show the jab date and excess deaths