
Were Charles Darwin and Robert Edgar Hope-Simpson right about Covid-19? - evidence part 3
Were Charles Darwin and Robert Edgar Hope-Simpson right about Covid-19? - evidence part 3
Transmission and lethality of Covid-19

Evidence for “early” Global Spread of Covid-19
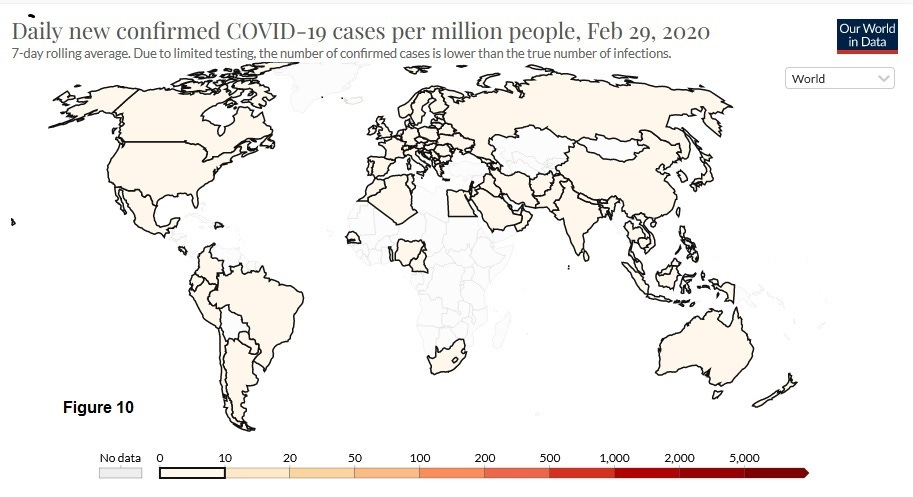
Case data in terms of absolute numbers is difficult to interpret because of the variation and policies of different countries with respect to testing. However it is probably reliable in terms of the timing of peak data provided testing was consistent during the particular time period. A summary of the analysis of the world wide peak data is as follows; 176 out of the 204 total available countries demonstrated a case peak in the period 15th March to the 19th April 2020. 84 countries demonstrated a very positive peak during this period (source Our World in Data)
The map below (Figure 10), whilst for an earlier period, highlights the distribution of those case peaks and detection levels;
The genomic emergence of the S1 mutation follows a very similar distribution (Figure 11);
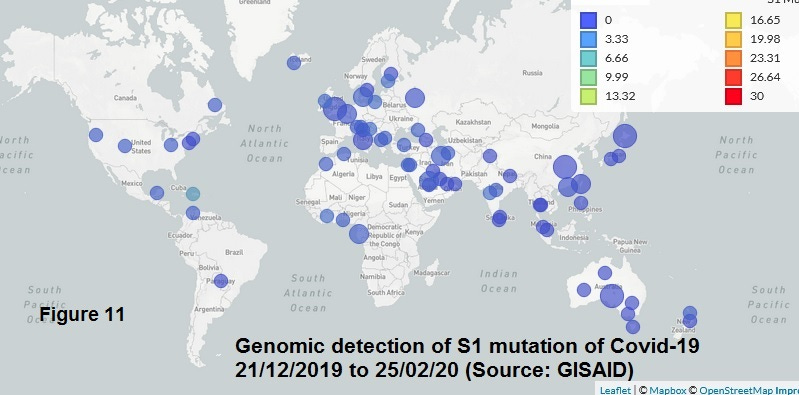
Whilst this data shows massive and consistent early spread of covid-19 around the world in is not consistent with the seasonal UV activation of the lytic cycles. This will be discussed later in this article.
The hypothesis proposes two primary feedback mechanisms to facilitate successful replication; host cell availability and the ability of selected mutations to escape the immune system to facilitate external transmission. One of these mechanisms is regulated by the rate of host cell infection and one by seasonal and daily exposure to specific conditions of UV light. Are there places on earth that evade the seasonality and have relatively consistent exposure to UV light? Countries on the equator have minimal exposure to seasonal variation so in theory they will eliminate seasonality. However we need to find a country / region that have adequate case testing and consistent UV exposure. Thus it is only exposed to daily regular UV induced feedback. Kenya does fulfil these requirements and is shown (Figure 12) below;
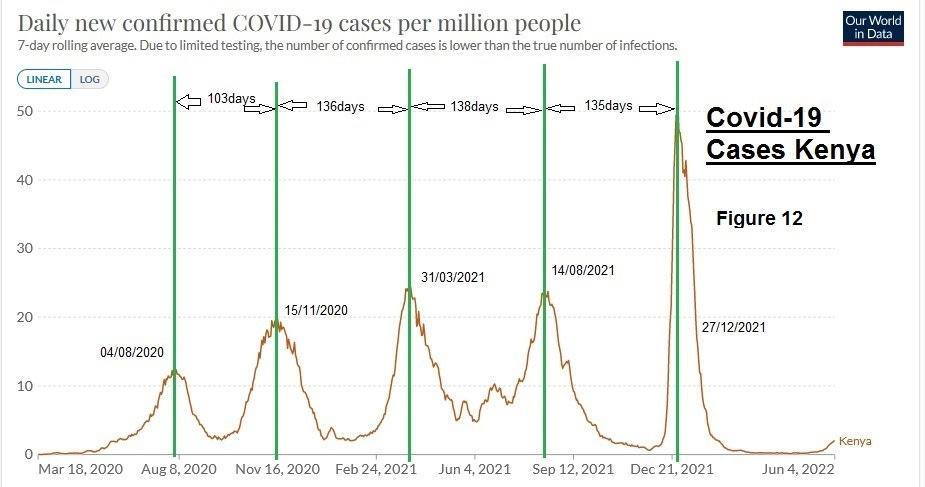
We can see that it has regular peaks (lytic cycle) at between 103 and 138 days.
If we now examine a country further south that has relatively consistent UV exposure but is now exposed to seasonality we see a different picture (Figure 12B);

The lytic cycle is being regulated by seasonal UV light and is now overriding the mutation / host cell regulation cycle.
Another option to minimise the impact of seasonality is to examine world case peaks as the North to South seasonality has the capability to cancel one another out;
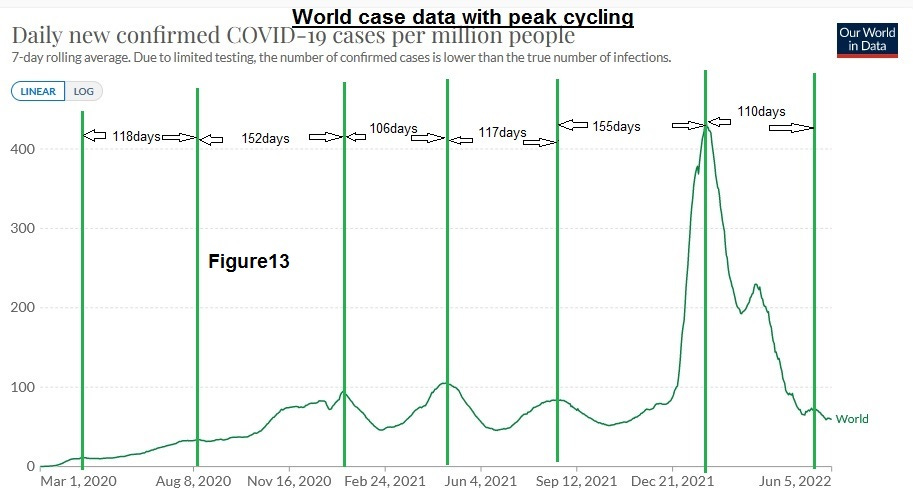
The average cycle time of the above chart is 126 days with strong evidence for a cycling affect. The average cycle for Kenya was 127 days. This world data, although corrected for population (cases / million) must be interpreted with the potential bias of the Northern hemisphere with respect to testing levels.
A potential hypothesis “black swan” exists in the form of another country on the equator, Equador, and this will be discussed at length later on in a later post.