
Were Charles Darwin and Robert Edgar Hope-Simpson right about Covid-19? - evidence part 5
Were Charles Darwin and Robert Edgar Hope-Simpson right about Covid-19? - evidence part 5
Transmission and lethality of Covid-19

Further analysis of South America
The region of the world that has been struck the hardest, in terms of excess mortality, is the North West region of South America. The extent of mortality is clearly the total area under the curve for a specified time period however the height and intensity of the peak provides further information. To demonstrate that degree of severity / intensity let us examine the three hardest hit South American countries and compared them with some European counterparts. In order to make this comparison we can use the height of the first wave in terms of percentage mortality and divide this by the period in days that the first wave existed (crossed and returned to zero or at a distinct inflection point). The following table (Table 3) represents that assessment;
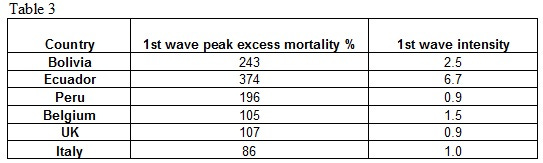
This table clearly illustrates how severe the North West countries of South America were struck by covid-19. What is also more startling is the intensity of the first wave for Ecuador. It is significantly greater than any other country. Does this data agree or conflict with the hypothesis?
Ecuador has been the subject of a number of papers (27) (28) on covid-19 because of this severity and intensity, the wide geographical differences within the country (altitude, temperature and humidity) and evidence for under reporting of covid-19 deaths. Within these studies there is a paper with some interesting regional maps and graphs of Ecuador taken at different time intervals providing essentially the same data described above (Figure 21);
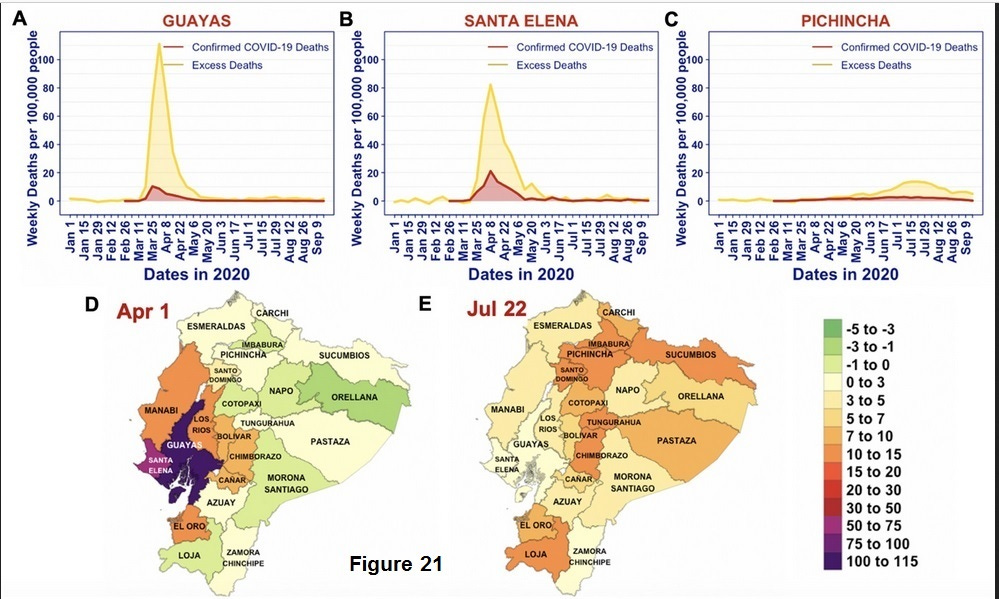
The spatial and temporal patterns of excess deaths in 2020 in Ecuador. (A–C) Time series for excess deaths (yellow; lighter colour) and documented COVID-19 deaths (red; darker colour) per 100 000 people in Guayas, Santa Elena and Pichincha. (D and E) Provincial maps of Ecuador showing the number of excess deaths per 100 000 people (colour) during the weeks of 1–7 April (panel D) and 22–28 July 2020 (panel E ).
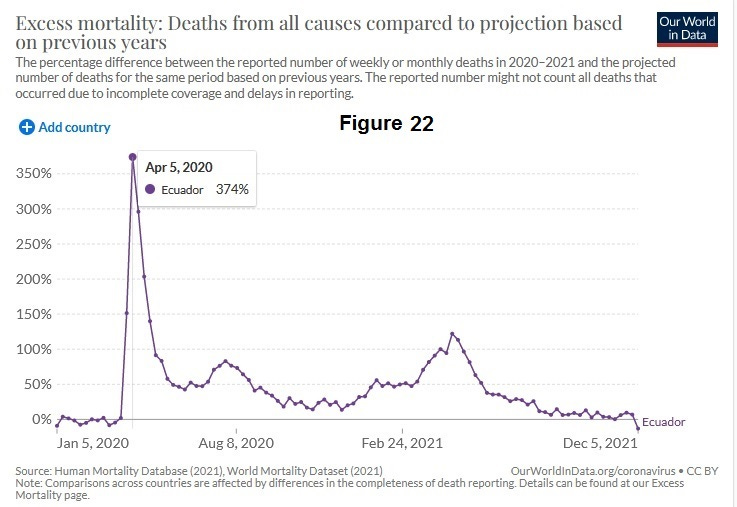
At face value these maps and charts are not in agreement with the proposed hypothesis with specific reference to those presented for the UK and Spain. The mortality peaks are not occurring at the same time point. To put Ecuador in perspective it is around 1.2 times the size of the UK and it has a population of 17.6 million. There appears to be a centre of transmission and massive intensity for the first wave peak around the regions of Guayas and Santa Helena with neighbouring regions, at this point in time, seeing virtually zero excess mortality. These regional deaths must be so great that they accounted for a high percentage of the peak seen in the Our World in Data chart provided below (Figure 22);
What could cause such severity? It appears that Bolivia, Peru and Ecuador have some of the highest UV exposure in the world and this is supported by the ozone maps shown above. This still does not agree with the proposed hypothesis. The northern part of Ecuador is on the equator so there is minimal seasonal change in day length. Regional temperatures do vary considerably however the most striking factor is the average amount of sunlight certain areas of the country receive with a persistence of “hazy light” and also low humidity (29). There are studies (30)(31) examining the impact of cloud cover on UV light and it is certain to have an impact in terms of wavelength and intensity (UVC and UVB wavelength bands) reaching the earth’s surface. In addition, because the intensity of light is varying through the day, depending on the angle of the sun to the earth surface, it is not inconceivable that a combination of ozone levels, morning and evening light intensity, and extreme cloud cover / haze could result in prolonged conditions conducive to a more persistent feedback signalling and therefore triggering of the virus and thereby dramatically increasing mortality. In addition because it is a warm climate, the proportion of people outside, will be higher thus creating a greater number of “super spreaders”. A combination of all these factors, with reference to the hypothesis, could result in a prolonged UV signalling stimulus and explain the severity and intensity of the covid-19 mortality seen in Ecuador. The hazy light conditions are primarily due to the Humbolt current creating prolonged periods of mist and haze down the heavily impacted North West coast of South America. Peru and Bolivia are also subject to this phenomena and this is reflected in their mortality data. As we move South down the coast the influence of the Humbolt current dissipates so Chile was much less affected.
Was the 1918-19 influenza pandemic a further example of seasonal triggering?
The devastating impact of the 1918-19 flu pandemic could be embraced by this hypothesis. Four major cities at similar latitudes, considerable distances apart, triggered at the same time with approximately the same intensity. If a seasonally activated viral challenge occurred, combined with age specific prior immunity, it could be responsible for the tragic mortality response. Versions of this theory have been proposed by a number of papers. The following graph (Figure 19) from that period (32) illustrates the simultaneous triggering;
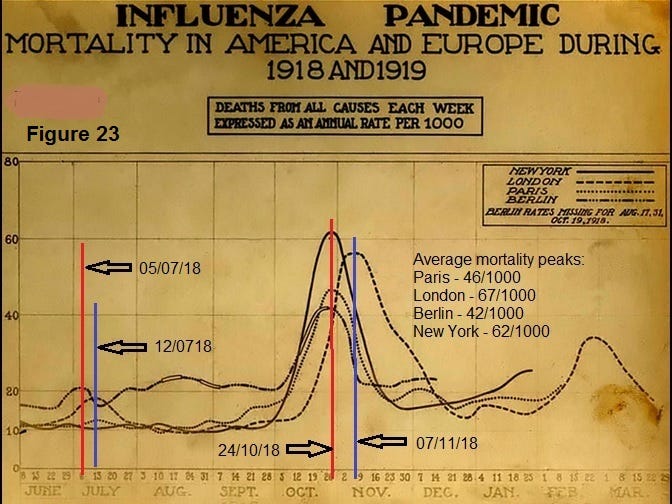
The median age of death for the 1918-19 flu pandemic was around 28 years old. This observation is the most concerning aspect of this whole paper as, if the above is correct, in exceptionally rare instances the immune systems of the young and healthy can be activated in a lethal manner.
Influenza human challenge studies during the 1918-19 flu pandemic
Also in support of the proposed hypothesis are the human challenge studies (33) that were performed during the 1918-19 influenza pandemic in order to try to understand transmission. In summary these studies, which would not be considered ethical today, involved trying to infect individuals by various routes of exposure to the virus from severely sick people. There were two studies conducted one in Boston and one in San Francisco. The Boston study involved 62 volunteers from a naval base and exposing them to influenza virus in a series of eight experiments. These experiments covered different modes of transmission from direct exposure to severely sick patients to inoculation with cultured virus. None of the volunteers contracted influenza. The similar study using 50 further volunteers in San Francisco was conducted to examine if there were regional differences but once again no individuals were infected. For the Deer Island Boston study there was a significant previous pandemic outbreak so the volunteers could have had prior exposure and thereby immunity. The study tried to identify any such previously infected individuals but this is possibly difficult to ascertain. The proposed hypothesis requires that for a severe / symptomatic reaction you require a mutation(s) that have recently evaded immune systems presenting a immune challenge. This was never achieved in either of these studies. They were effectively attempting a viral challenge from a pre-existing mutation to healthy primed immune systems and hence got no reaction. The deadly nature of the 1918 -19 may well have been caused by this seasonally triggered mutation escape challenge process but was particularly vicious when it could be induced in younger individuals with healthy immune systems.
Correlation of normal mortality and covid-19 attributed deaths
The proposed hypothesis requires that a relatively “new” viral infection is relatively harmless to a huge proportion of the population. The selection of a significant mutation from a healthy immune system that then infects a less healthy individual can lead to a more severe or lethal outcome. Our immune systems deteriorate with age (immunoscenescense) and our general health. This would lead us to expect that mortality from covid-19 would track the “normal” health of the population rather than a random impact on mortality from a specific susceptibility to a pathogen. If this is the case we would expect to see a strong correlation of normal age specific mortality versus covid-19. Here is that plot (Figure 24) for the USA and UK;
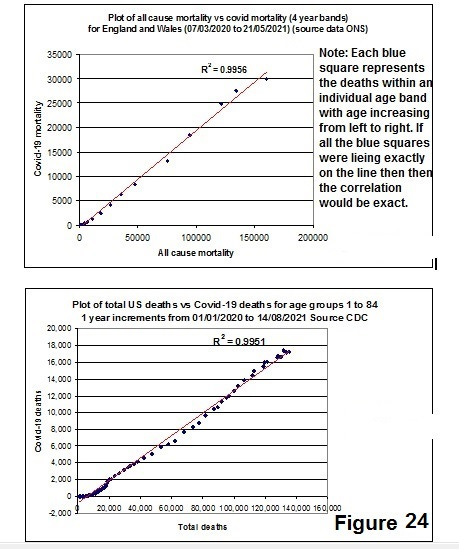
The correlation coefficient (R2) value quoted above is a measure of how well two sets of data match. A perfect correlation is 1.0000. The R2 value for the USA (0.9951) and UK (0.9956) are in very close agreement and indicate strong alignment of normal health mortality risk with that of covid-19.
Is the mortality risk the same the world over?
If we compare the age related covid-19 mortality for the UK versus two of heaviest impacted countries, Peru and Ecuador, the age related mortality risk appears to be virtually identical (Figure 25 & 26);
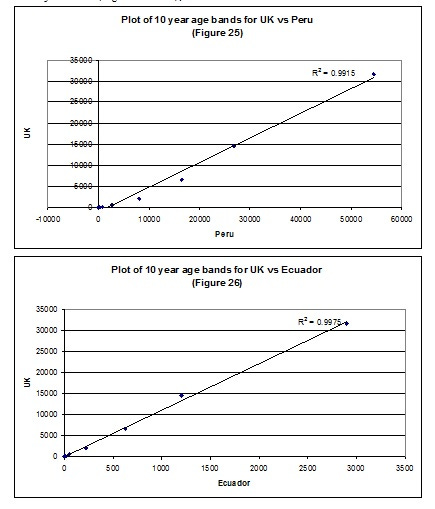
The strong correlations would indicate that the cause of risk of mortality is the same for these countries in spite of widely differing excess mortality rates.
Note the data is not exactly equivalent in terms of deaths numbers as the data has been extracted with different units but since these are constants across the age ranges the straight line relationship and respective correlation coefficients are valid.
Strange covid-19 outbreaks
There is the case of the Argentinean trawler outbreak (34) that contradicts the accepted measles type transmission narrative for which this hypothesis offers a plausible explanation. This covid-19 outbreak occurred on an Argentine fishing boat after 35 days at sea, with the crew having been isolated for 14 days prior to boarding. Of the 61 crew-members onboard the 'Echizen Maru' 57 tested positive for covid-19.
There is also a recent analogous incident where polar researchers in remote Antarctica tested positive for covid-19, despite taking strict health precautions, being fully vaccinated and miles from civilisation (35) Two thirds of the 25 staff based in Belgium's Princess Elisabeth Polar Station caught covid-19. All 25 researchers were fully vaccinated and one had a booster shot. Prior to leaving for the station, they underwent a PCR test in Belgium two hours before flying to South Africa. In South Africa, they quarantined for 10 days and took another PCR test. A further test was needed when leaving Cape Town for Antarctica and a final one five days after that.
Both of these isolated covid-19 outbreaks align well with the REHS’s modified hypothesis but are a poor fit for the measles type transmission narrative.
Super Spreaders
There seems to be reasonable evidence for the concept of super spreaders as it appears from modelling evidence that 90% of infections come from 10% of individuals which is supportive of the proposed hypothesis (36).
Australia
Australia was portrayed as being an initial covid-19 success story in terms of cases and deaths with its isolation policies and the advantage of being an island. The proposed hypothesis would not allow this to occur because of the extent of world travel and the early spread of the virus. What does the case data indicate?
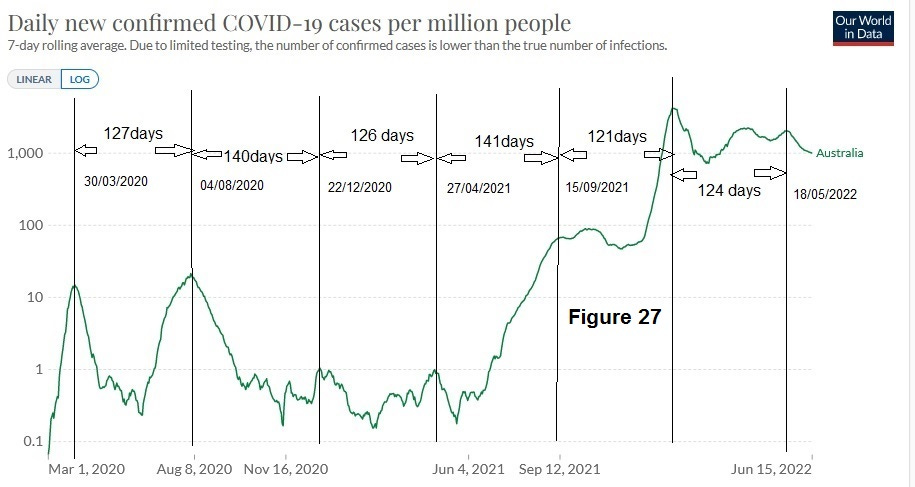
It is necessary to use the rather useful log function in the Our World in Data site to examine covid-19 case event for Australia as the Omicron wave was orders of magnitude greater than the first peaks. However we can see that there are a series of peaks dating back to 30th March 2020. In addition there was a continuous case signal for the entire period. If we also examine genomic surveillance Australia was also indicating significant early exposure. See figure 11.
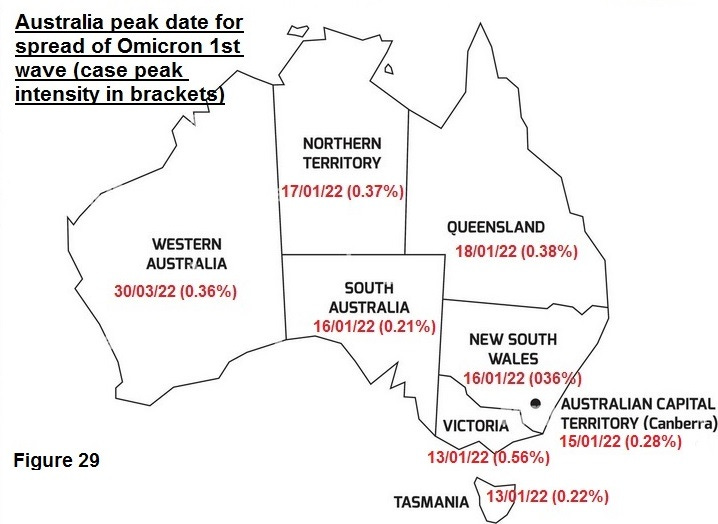
If we now examine state data in terms of case peak data (source; Our World in Data) we have for the first wave;
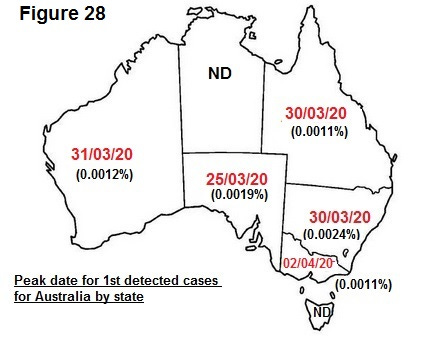
Cases are triggering once again in a very tight time frame (8 day) for states that are 4000 km apart.
If we examine the data for the Omicron wave we see a similar affect;
The case and genomic data are in agreement with an early period of global transmission and the case data indicates this was the case for the whole of Australia. The reason that Australian mortality levels were so low, and for an extensive area surrounding Oceania, must be due to factors impacting the reaction of the immune systems. If there were factors such as high UV light and prior immunity that allows early spread of the virus that avoids triggering it could result in less lethal waves. Effectively the region of Oceania was the opposite of the North West region of South America.
Pandemic measures as an experiment
Many areas of the world embarked on a number of severe measures. What would be the predicted outcome based on this hypothesis?
Track and trace
The hypothesis requires that only a limited proportion of people are briefly intensely infectious. PCR or lateral flow testing do not indicate whether an individual is infectious they simply identify an immune response. The high percentage of initial spread of the virus would effectively mean that the horse has bolted in terms of the likely impact of containment measures. This would predict that track and trace would be virtually totally ineffective.
Lockdowns
Since the virus has transmitted during a earlier transmission phase to a huge proportion of the population and people only become infectious when they are seasonally activated there would be little or at best a delayed response resulting from this strategy.
Masks
The wearing of masks for a highly infectious respiratory virus such as covid-19 would have little bearing based on particle size and, if worn externally, could facilitate greater inhalation of UV exposed virus thus accentuating the triggering affect.
Vaccines
The hypothesis requires that a high percentage of the population have been exposed and developed prior immunity to specific variants. The immune system is highly complex and predicting the reaction to a further immune challenge in the form of a vaccine is very difficult. In addition the hypothesis would predict that the variants would become less and less lethal as immune systems around the world combat the various mutations an it becomes less and less “novel”.
Summary and Conclusions
It is with a high degree of certainty that seasonally activated viral triggering occurs in terms of covid-19 mortality. As this triggering event is seasonal it must be related primarily to sunlight. No other factor, such as humidity, temperature, vitamin D levels, indoor exposure etc. could account for the extreme seasonal synchronicity and repeatability of the mortality events listed above.
The transmission narrative and consequent mortality that has formed the basis of the world wide response to the pandemic is fundamentally flawed. The data presented in this paper better supports an initial, fairly harmless transmission wave, resulting in a very high proportion of individuals carrying the virus at a very low (latent) level as described by REHS. These individuals, once exposed to highly specific seasonal conditions of UV light become reactivated and highly infectious “super spreaders”. This only becomes significantly more harmful when there is a significant immune challenge from selected mutations. The rapid triggering and resulting rapid rise in mortality resulted in the majority of the governments of the world panicking and implementing various measures that would have limited impact, at least according to this hypothesis. Further experiments should be able to confirm the existence of UV viral triggering.
The true extent of infection and the factors that influence the state of equilibrium / latency of an individual and viruses such as covid-19 need to be further examined. The key conclusions from this proposed hypothesis is that overall immune health, prior immunity, age demographic, and the emergence of highly specific seasonal conditions are the major factors with respect to the mortality impact of covid-19 and potentially other respiratory viruses.