
Were Charles Darwin and Robert Edgar Hope-Simpson right about Covid-19? - evidence part 4
Were Charles Darwin and Robert Edgar Hope-Simpson right about Covid-19? - evidence part 4
Transmission and lethality of Covid-19

Evidence of viral persistence and ongoing mutation
The hypothesis requires evidence for prolonged widespread infection and ongoing mutation. There appears to have been a rather limited number of studies that have investigated this aspect of covid-19 infection but the following at least two are supportive that this phenomenon exists. The first (16) of these studies examined SARS-CoV-2 infection and persistence throughout the human body and brain. This study performed autopsies on 44 patients with COVID-19 to map and quantify SARS-CoV-2 distribution, replication, and cell-type specificity across the human body. Covid-19 RNA was detected in multiple anatomic sites, including regions throughout the brain, for up to 230 days following symptom onset. Covid-19 RNA was detected in respiratory tissue of 43/44 cases (97.7%);cardiovascular tissue of 35/44 cases (79.5%); lymphoid tissue of 38/44 cases (86.4%);gastrointestinal tissue of 32/44 (72.7%); renal and endocrine tissue of 28/44 cases (63.6%); reproductive tissue in 17/40 cases (42.5%); muscle, skin, adipose, and peripheral nervous tissue in 30/44 cases (68.2%); ocular tissue and humors of 22/28 cases (57.9%); and brain tissue in 10/11 cases (90.9%). In terms of variable mutations existing this study stated the following; “Overall, these findings suggested no need for alterations in receptor utilization to permit extrapulmonary dissemination of SARS-CoV-2, while also revealing genetic compartmentalization between viruses in the lung lobes and those in extrapulmonary sites, including the brain.” It is worthy of note that the brain and heart are considered immune privileged sites which means that the body has limited defences in these locations and provides further evidence of potential viral persistence and the possibility that this is involved in the mechanism of latency.
The second paper (17) was a case study of an HIV positive 36 year old South African woman who was admitted to hospital for reasons other than covid-19 but tested positive on arrival. This individual enrolled in a study examining the persistence of covid-19 in individuals with advanced HIV. Samples were taken at the eight time points from day 20 to day 233 for PCR testing, antibody analysis, and genomic sequencing. The study concluded the following; “Despite a short clinical illness of moderate severity, SARS-CoV-2 PCR positivity persisted up to 216 days. We demonstrate significant shifts in the virus population over that time, involving multiple mutations at key neutralizing antibody epitopes in the spike RBD and N terminal domain (NTD)”.
Both of these papers do provide evidence for ongoing persistence and mutation of covid-19 within individuals.
Genomic data
There has been an unprecedented amount of genomic testing during the covid-19 pandemic. The central repository for global covid-19 genomic testing is the GISAID data base. There are a number of useful features within this data base that allow us to view the prevalence of variant strains and the degree of spike mutation. This database also allows us to compare regions. Below (Figure14) is a comparison of Europe as a high covid-19 impacted region of the world compared with Oceania as the lowest;

The hypothesis requires a global spread of the virus with a constant mutation rate and this is supported by the consistent timings of the emergence of the variant clusters for two widely different regions in terms of reported case rate and mortality.
Shape and predictability of the pandemic curve
Further supporting data lies in the form of the basic shape of the pandemic curves whether we examine antibody studies or more reliably excess mortality. All initial pandemic peaks have a sharp rise and then a rapid fall impacting, in terms of mortality, a very limited portion of the population that can be predicted mathematically from the first few weeks of data(18)(19). From this mathematical predictability is it is implicit that this is a finite response to a finite stimulus (UV light conditions) to a finite susceptible population (prior immunity)? A good example of this finite affect is Belgium where we had a similar mortality response to covid-19 mortality wave from an August 2020 heat wave occurring several months after the 1st pandemic wave (Figure 15);
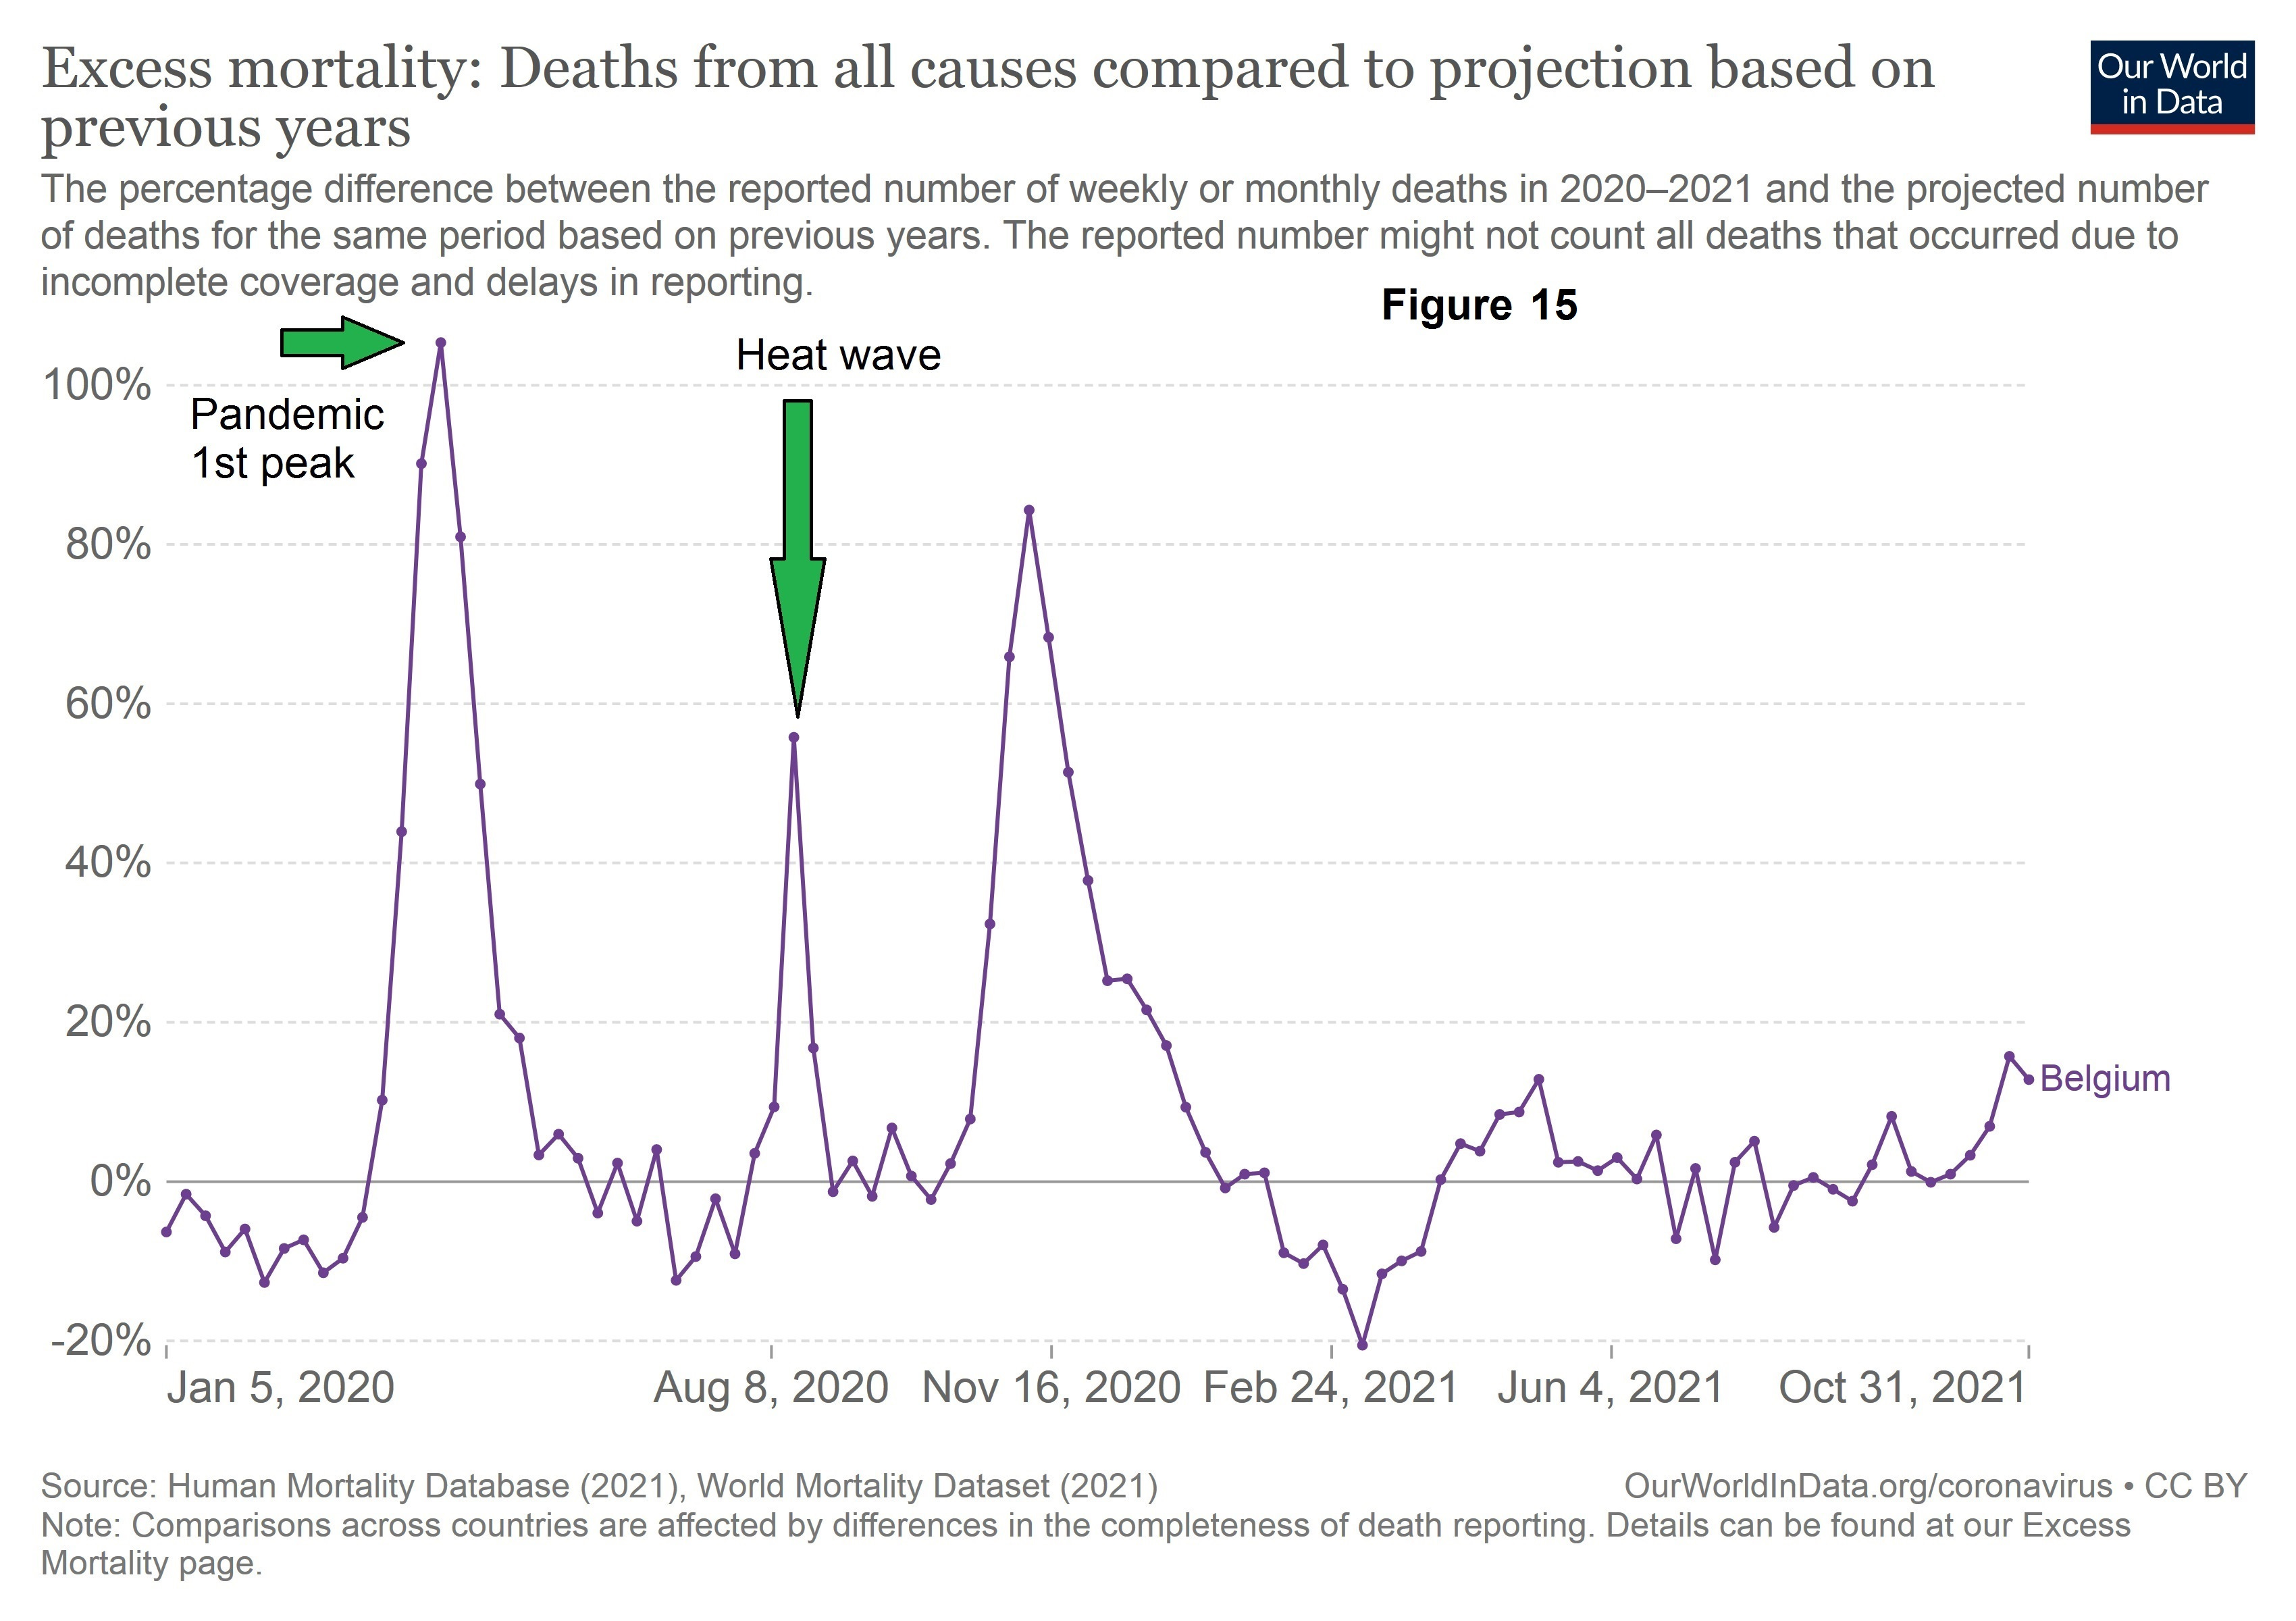
The shape of the excess mortality curve is in good agreement with the proposed hypothesis of a relatively short lived finite stimulus. In the case of the first mortality wave that stimulus is specific conditions of UV light in the case of the heat wave a short period of extreme temperatures.
Further Genome Studies
The proposed hypothesis requires that there is a mutation / genome rise prior to any excess covid19 mortality peak as it requires an increased escape of mutations triggered initially by a feedback process involving specific conditions of UV light. Below is a graph (Figure 16) from a UK covid-19 genome study (20) which provides the start and peak dates of this emergence;

Note- TMRCA; time to the most recent common ancestor
The dates from this graph have been transcribed to the PHE REACT study (Figure 6) graph above and are in strong in agreement with the proposed hypothesis.
A degree of correlation between the rate of genome rise and mortality would also be expected if the hypothesis is correct. Taking the data from the above graph and plotting it alongside the rise in mortality for the first wave we get the following (Figure 17);

The gradient of rise and fall of both curves match quite closely indicating a strong correlation between the two. For the rise in mortality and genome emergence the correlation coefficient is 0.991.Note the rise in the frequency of genomes has been scaled up by a constant factor that makes the peaks an equivalent height.
We can also plot the log rate of rise of genome emergence (Figure 18) and we can see that we get a reasonable straight line;
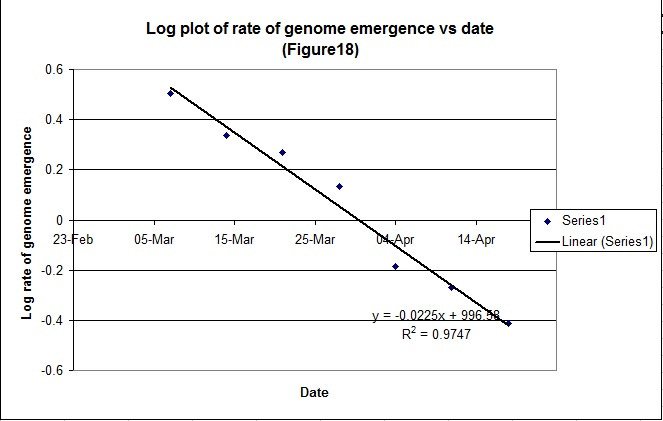
It is implicit, as for the mortality data, that we can predict the peak date (29th March) from the first few data points where it intercepts the X axis indicating that the genome rise is as result of a finite response to a finite stimulus. This is in good agreement with the proposed hypothesis.
Impact of UV light on viral RNA
The hypothesis requires that UV light at different wavelengths, intensity and exposure time has the capability to trigger a lytic cycle of the virus. There have been quite a few studies examining germicidal impact of UV light to inactivate viruses / covid-19. One such study (21)examined covid-19 RNA damage across the UV wavelength spectrum. In summary this paper clearly demonstrated that covid-19 viral RNA is sensitive to UV light specific to wavelength and therefore could have the potential to modify / cleave the virus.
Secondary Attack Rates (SAR)
There have been a considerable number of studies examining the SAR for covid-19. SAR is defined as the proportion of people that become infected from a primary case. The hypothesis requires that secondary cases originate from reactivated “super spreaders” and have very limited infectious potential so we would expect to see a low level of SAR. Examining the data from a meta study (22) which reanalysed 32 studies using network meta-analysis from a total of 2606 citations .These studies involved 68,260 close contacts from which 2406 were infected. The criteria for study selection are provided in the referenced paper. The SAR data from this meta study is summarised in the table below (Table1) for seven key contact settings;
Table 1
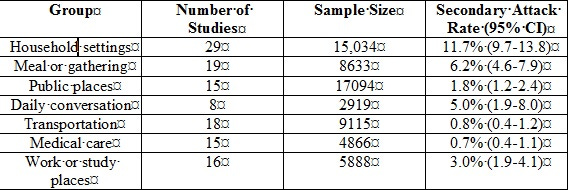
The SAR is very low in most settings which align well with the REHS’s hypothesis and the current proposal. It is quite evident that ongoing transmission from a primary case is relatively low and is not consistent with measles type transmission scenario which, specific to measles, is in excess of 90%. There have been other studies which have identified the SAR as high as 38%. This is not necessarily in conflict with the hypothesis as identification of a primary case is inherently difficult and the degree of variation could be due to the brief period of infectivity of reactivated individuals.
Weather and existing UV studies
There is a modest degree of correlation for UV light, temperature and humidity (23) The failure to examine UV exposure, in terms of specific wavelength and intensity, means that these studies will be expected to demonstrate a positive but limited correlation and this does appear to be the case.
Excess Winter Mortality (EWM) UK data
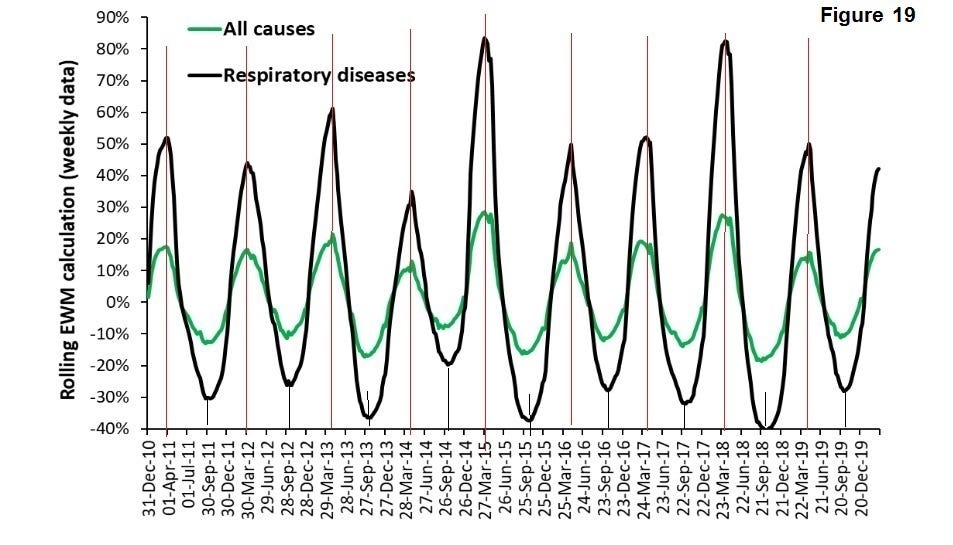
EWM is a measure of comparing the winter excess mortality against the summer period. EWM compares four winter months with eight summer months so it is essentially the relatively of those periods within a year. It offers a means of examining the severity of a season and a greater peak and trough definition. The following graph (Figure 19) (24) presents excess winter mortality for the UK over a significant recent period for all causes and respiratory viruses;
The following table (Table 2) is the variation of peak data;
The variation (standard deviation) of peak winter mortality and respiratory diseases is less than 10 days. This reinforces that, whilst the covid-19 pandemic is much more severe, this mortality phenomenon occurs every year with great regulatory and is supportive of seasonal triggering of many respiratory viruses. Viruses have existed and evolved over many thousands of years, which includes the family of coronoviruses (25) and it is likely that the UV induced feedback mechanism has been a significant selected advantage for some time.
Impact of Latitude
We might also expect, if this hypothesis is correct, to see a significant impact of latitude on excess winter mortality (EWM) and a huge analysis (26) found this to be the case (Figure 20);
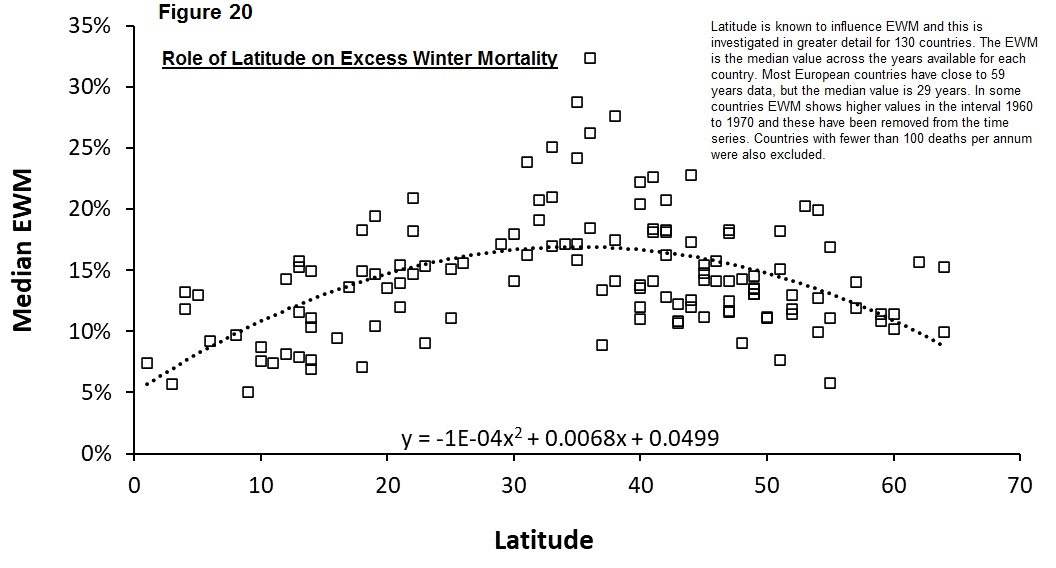
This plot demonstrates a gradual curve peaking at 37° latitude as the angle of the sun is more conducive to viral triggering.
Part 4 to follow.
