
Were Charles Darwin and Robert Edgar Hope-Simpson right about Covid-19? - evidence part 2
Were Charles Darwin and Robert Edgar Hope-Simpson right about Covid-19? - evidence part 2
Transmission and lethality of Covid-19

Evaluation of the hypothesis (see previous post)
When considering supporting data for the above hypothesis one must clearly consider the strength and reliability of that data. The reporting of mortality data is likely to be highly reliable with respect to numbers and timings.
The following are summary maps of mortality data published by the UK Office of National Statistics (ONS), EuroMoMo and Our World in data. One assumes that for individual countries it is from a common source. Below is the extensive ONS UK data (Figure 1);
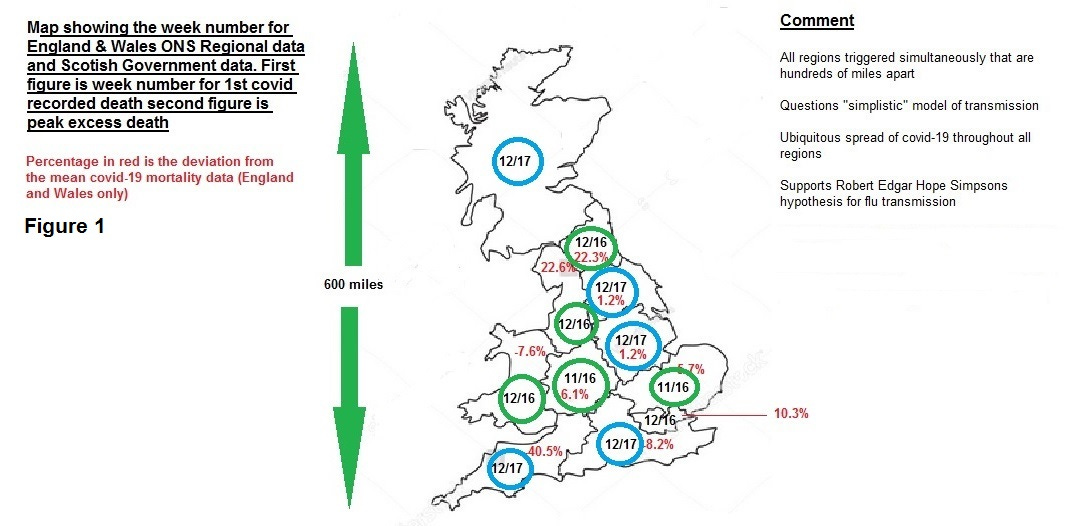
This map of the UK tells us that the spread of covid-19, in terms of mortality is occurring within a three to four day window. In addition there was very little regional variation of intensity in deaths per million (with the exception of the South West) How could this occur if there was a centre / origin of transmission? Why do regions that are hundreds of miles apart, trigger and peak within a three to four day window? A conventional “measles” transmission model is inconceivable.
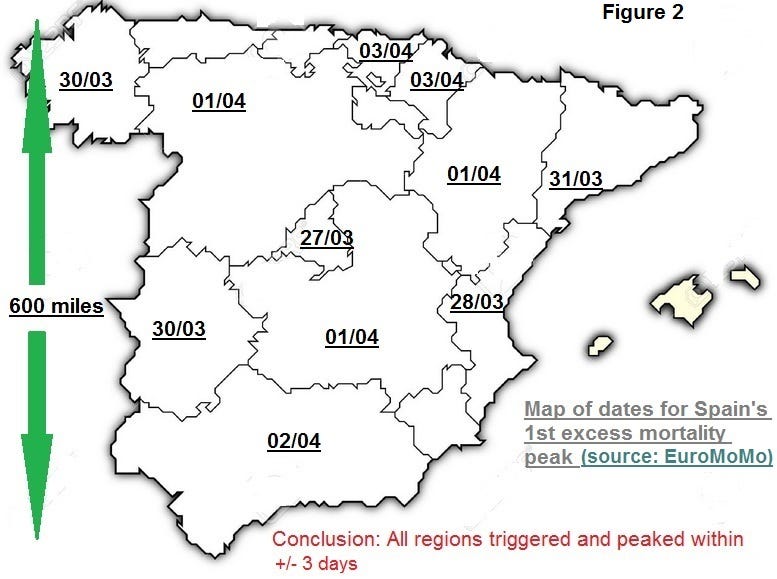
This is the same analysis for Spain (Figure 2), where the EuroMoMo data is recorded in terms of a date as opposed to week numbers, and it mirrored the UK;
If we then examine Europe as a whole (Figure 3);
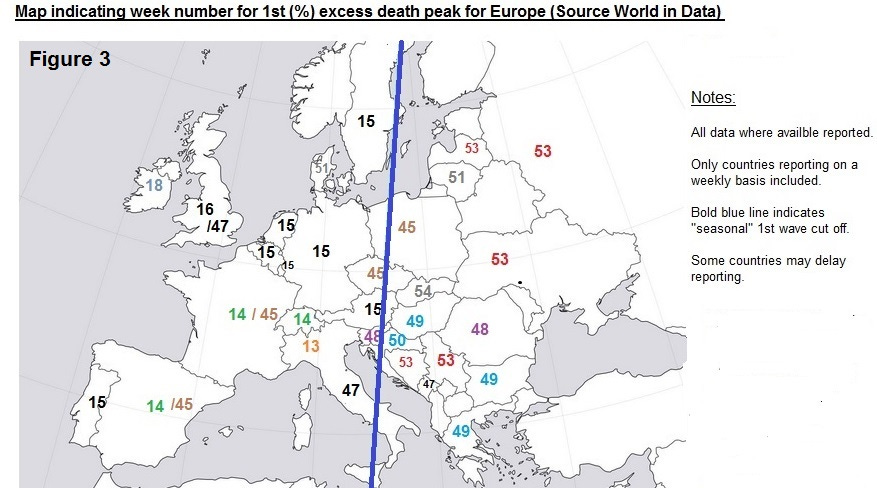
Once again there are many countries triggering at the same time point. What is more intriguing was the cut off running East to West (bold blue line) across Europe? Does the virus only transmit in one direction?
Below is the maximum excess mortality peaks for USA using the CDC state data (Figure 4);
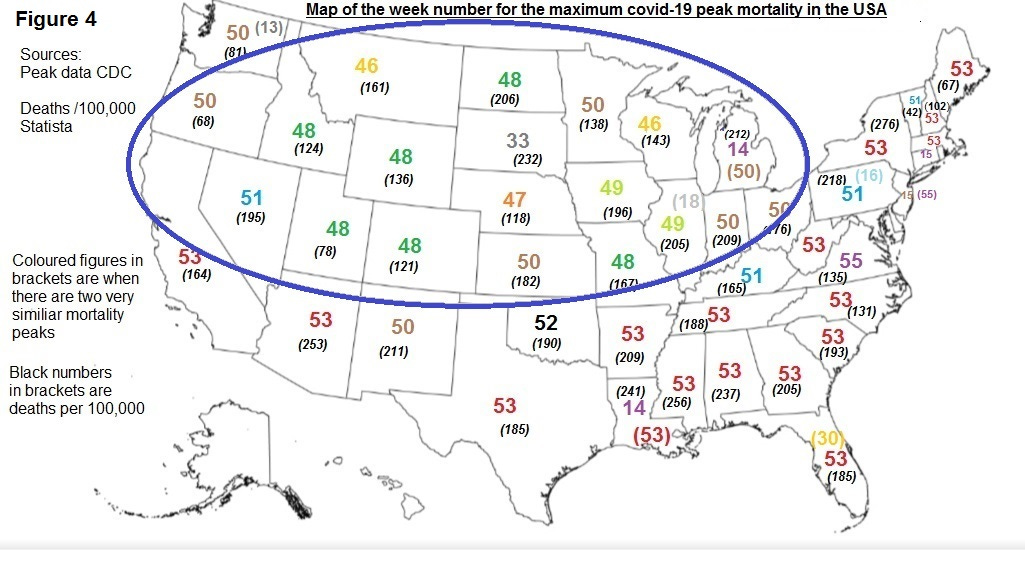
Mortality is triggering in many states at the same time (17 at week 53) that are thousands of miles apart. The mortality date peaks are not following the East to West trend, as seen in Europe, but there is a pattern (blue circle). What could account for this strange data?
The highest levels of covid-19 excess pandemic related mortality have been seen in South America. Examining the mortality data for that continent (Figure 5) ;
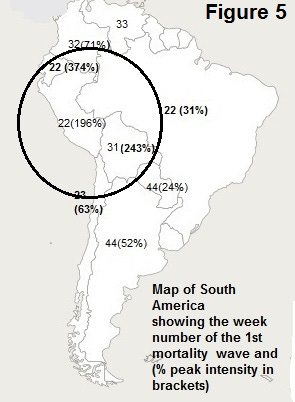
This map indicates a much greater severity in the North Western countries (circled in black) of South America (Peru and Ecuador).
Any alternative hypothesis to the measles type transmission must therefore accommodate this simultaneous triggering of covid-19 mortality in geographical areas huge distances apart.
· There are theories supported by some data that viruses can transmit over long distances by transmitting on high altitude winds.
· The virus could spread with enormous speed to all regions given air travel and population connectivity and a measles transmission narrative.
· There is also strong evidence that, some viruses, can exist in a latent state (9) (10) and be triggered into a lytic / infectious state and this is known for certain types of viruses such as herpes.
The proposed hypothesis requires the timing of the lytic and lethal cycles to be coordinated by seasonal UV light. Does the above data offer any support for that hypothesis? Ubiquitous viral exposure and infection followed by a triggering event is strongly supported by the data from Spain and the UK. However the maps examining the larger geographical areas such as Europe, USA and South America, whilst they demonstrate simultaneous viral triggering in countries / states that are huge distances apart, do the patterns agree with the proposed hypothesis? What caused the east to west cut of in Europe? What caused the patterns in North and South America? The hypothesis requires that specific conditions of UV light are required to provide signal to the virus to move to intense an lytic cycle. The main factors that influence the wavelength and intensity of UV light striking the earth are seasonality i.e. the angle which the suns rays strike the atmosphere and the ozone layer. These two factors vary on a daily and seasonal basis. Ozone has the ability to absorb and protect us from UV light, in particular the higher energy UVC and UVB wavelength range. If this is the case do the ozone levels vary over the earth in a seasonal manner that could account for the anomalies in Europe and North and South America presented in the maps above? An examination of seasonal ozone levels striking the earth surface is available from a number of sources. In order to make this assessment we need to identify a relevant period. In order to perform this I will reference the graph provided by the Public Health England (PHE) / Imperial College REACT study (11) (Figure 6) which examined covid-19 infections, measured on the basis of antibody studies combined with symptoms. This PHE chart in itself is strongly supportive of the proposed hypothesis with an initial (greater than 3 month) relatively harmless infection phase followed by an abrupt triggering event.
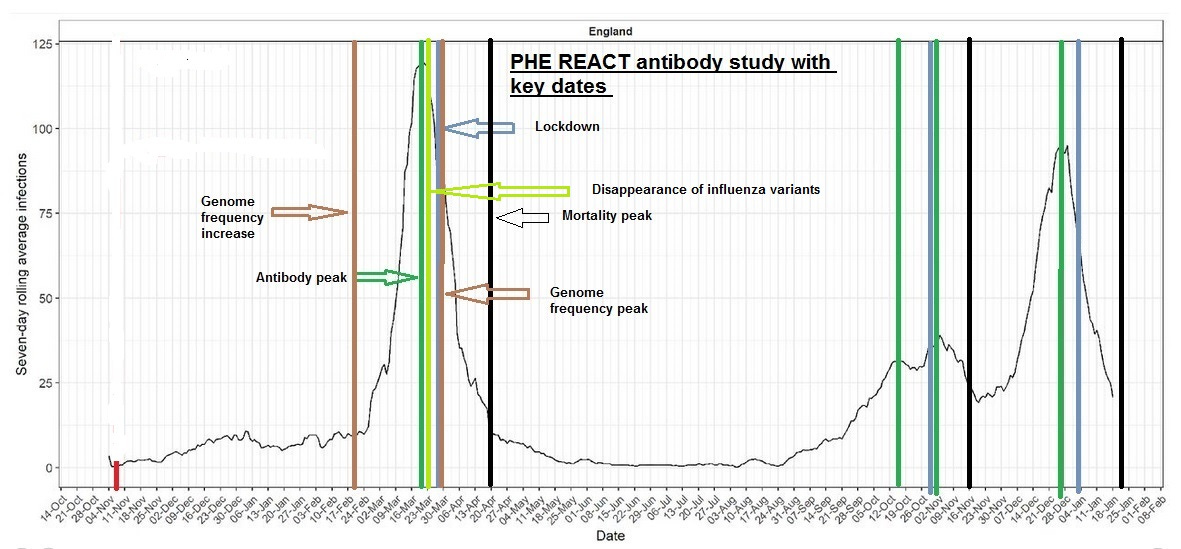
The hypothesis requires an initial a UV triggering event, indicated by a genome frequency rise / release of successful mutations (brown line), an immune response indicated by the antibody rise (green line), and then the mortality peak (black line). From this data we can make a reasonable estimation of the time lag between the seasonal activation and mortality peak, this equates too approximately two months. Performing this exercise we arrive at the respective dates of interest as follows;
Europe –early to mid February
USA – late September
South America – late March
Here are selected total and tropospheric column total ozone maps relating to those periods. This data has been obtained from NASA (12) and Environment Canada (13)
Europe –early to mid February (Figure 7)
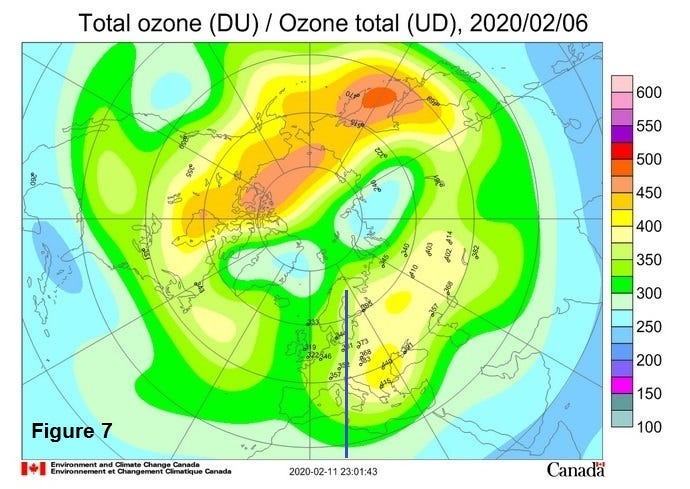
Taking the striking cut off across Europe and comparing it to ozone levels at a relevant time period we can say that there is a broad match to the map of Europe provided above.
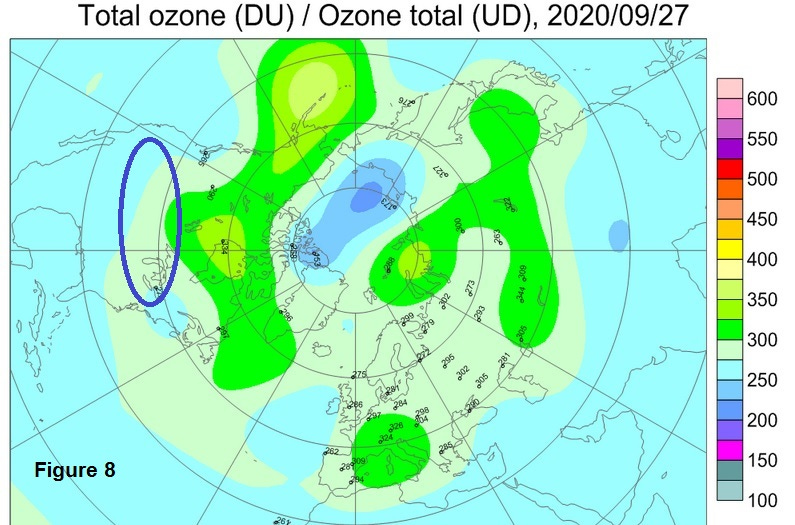
If we now examine the mortality date pattern with a relevant ozone map for the USA (late September) (Figure 8);
A similar comparison for South America is given below (note the daily format available from the web site used for the maps above is limited for South America) (Figure 9);
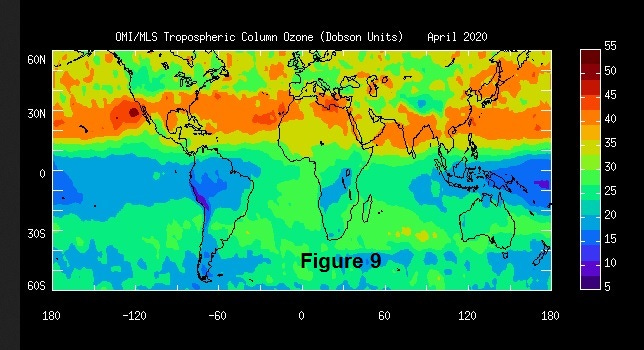
There is a reasonable fit, albeit for only a monthly average, over the relevant period.
Annual seasonal consistency of ozone levels across regions of the earth’s surface are required for the validity of this hypothesis and a review of this data indicates that this is the case. Total ozone is the total amount of ozone in a vertical column from the troposphere reaching the earth's surface. Ozone is primarily determined by measuring the adsorption of UV light at different wavelengths and then using a process of extrapolation.
Misa many thanks for pointing this out and showing an interest. I have hopefully now corrected this. If this does not work please let me know and I will send you pdf links to the complete paper.
I'm glad you have highlighted and attempted to explain the obvious, longitudinal cutoff between east and west Europe that people have criticised me for identifying and trying to explain. One hypothesis that keeps coming up is relative disruption to healthcare systems. There is definitely strong correlation between GDP per capita / healthcare spending and COVID mortality outcomes.